The Measure of the Wealth of Nations: Why Economic Statistics Matter
Are things getting better?
For whom? What does “better” mean?
The economic and social phenomena so clear in everyday experience are invisible in the standard national accounts and GDP (Gross Domestic Product) statistics. The current concept of value added used to construct GDP numbers does not correspond to the views many people hold about societal value. This disconnect has given momentum to the Beyond GDP movement and to those similarly challenging the metrics of shareholder value that determine how businesses act. The digitalization of the economy, in shifting the ways economic value can be created, amplifies the case for revisiting existing economic statistics.
Without good statistics, states cannot function. In my work focusing on both the digital economy and the natural economy, I have worked closely with official statisticians in the ONS (Office for National Statistics), BEA (Bureau of Economic Analysis), OECD (Organization for Economic Cooperation and Development), INSEE (National Institute of Statistics and Economic Studies), and elsewhere for many years. Without question there has been a widespread loss of belief in conventional statistics even among knowledgeable commentators, as the vigorous Beyond GDP agenda testifies.
Why Not Well-Being?
An alternative metric of social welfare that many people find appealing is the direct measurement of well-being. Economists who focus on well-being have differing views on exactly how to measure it, but the balance of opinion has tilted toward life satisfaction measured on a fixed scale. One such measurement is the Cantril Ladder, which asks respondents to think of a ladder, with the best possible life for them being a 10 and the worst possible life being a 0, and are then asked to rate their own current lives on that 0 to 10 scale.
Although people’s well-being is the ultimate aim of collective action, using it as a measurement is problematic in several ways. One is the set of measurement issues highlighted in research by Mark Fabian. These include scale norming, whereby when people state their life satisfaction as, say, a 7 on a scale of 1 to 10 at different time periods, they are doing so by reference to the scale rather than events in their life.1, 2 One of the more firmly established behavioral facts is the idea of an individual set point, whereby individuals generally revert to an initial level of well-being after experiencing events that send it up or down, but this is hardly a reason for concluding that nothing can improve in their lives.
Although people’s well-being is the ultimate aim of collective action, using it as a measurement is problematic.
Another issue is that the empirical literature is atheoretical, providing a weak basis for policy intervention in people’s lives. The conclusion from my research project on well-being is that while national policy could certainly be informed by top-down life satisfaction survey statistics, at smaller scales people’s well-being will depend on the context and on who is affected; the definition and measurement of well-being should be tailored appropriately, and it is not a very useful metric for policy at an aggregate level.
Why Not an Alternative Index?
GDP is calculated by summing up the total value of all final goods and services produced within a country’s borders during a specific period, typically a year. Over the years, several single indices as alternatives to GDP have been proposed. However, indices internalize the trade-offs to present a single number that advocates hope will dethrone conventional measures. Some of these are explicit about the social welfare framework they involve.
Another alternative is provided by Jones and Klenow (2016),3 who include consumption, leisure, inequality, and mortality in social welfare. They convert other indicators into “consumption-equivalent welfare,” which has a long tradition in economics.4 In their paper, they observe that France has much lower consumption per capita than the United States—it is only at 60 percent of the U.S. level—but less inequality, greater life expectancy at birth, and longer leisure hours. Their adjustment puts France at 92 percent of the consumption-equivalent level of the United States.
A well-established alternative to GDP is the Human Development Index (HDI), inspired by Nobel Prize winning economist Amartya Sen’s capabilities approach—improving access to the tools people use to live a fulfilling life. The index demonstrates the dangers of combining a number of indicators, each one measuring something relevant, without having a conceptual structure for the trade-offs and how the components should be weighted together. The late Martin Ravallion of the World Bank advocated for a multidimensional set of indicators, with the aggregation necessary to get to these being informed by talking to poor people about their priorities:
The role played by prices lies at the heart of the matter. It is widely agreed that prices can be missing for some goods and deceptive for others. There are continuing challenges facing applied economists in addressing these problems. However, it is one thing to recognize that markets and prices are missing or imperfect, and quite another to ignore them in welfare and poverty measurement. There is a peculiar inconsistency in the literature on multidimensional indices of poverty, whereby prices are regarded as an unreliable guide to the tradeoffs, and are largely ignored, while the actual weights being assumed in lieu of prices are not made explicit in the same space as prices. We have no basis for believing that the weights being used are any better than market price.5
Why Not a Dashboard?
One frequent proposal, which certainly has intuitive appeal, is replacing the political and policy focus on GDP growth and related macroeconomic statistics with a broader dashboard. But there are three big challenges related to what to display on the dashboard. One, which indicators? A proliferation of alternatives has focused on what their advocates think is important rather than being shaped by either theory or broad consensus. So potential users face an array of possibilities and can select what interests them. Second, there are trade-offs and dependencies between indicators, and although dashboards could be designed to display these clearly, often they do not. Consequently, the third challenge is how to weight or display the various component indicators for decision purposes.
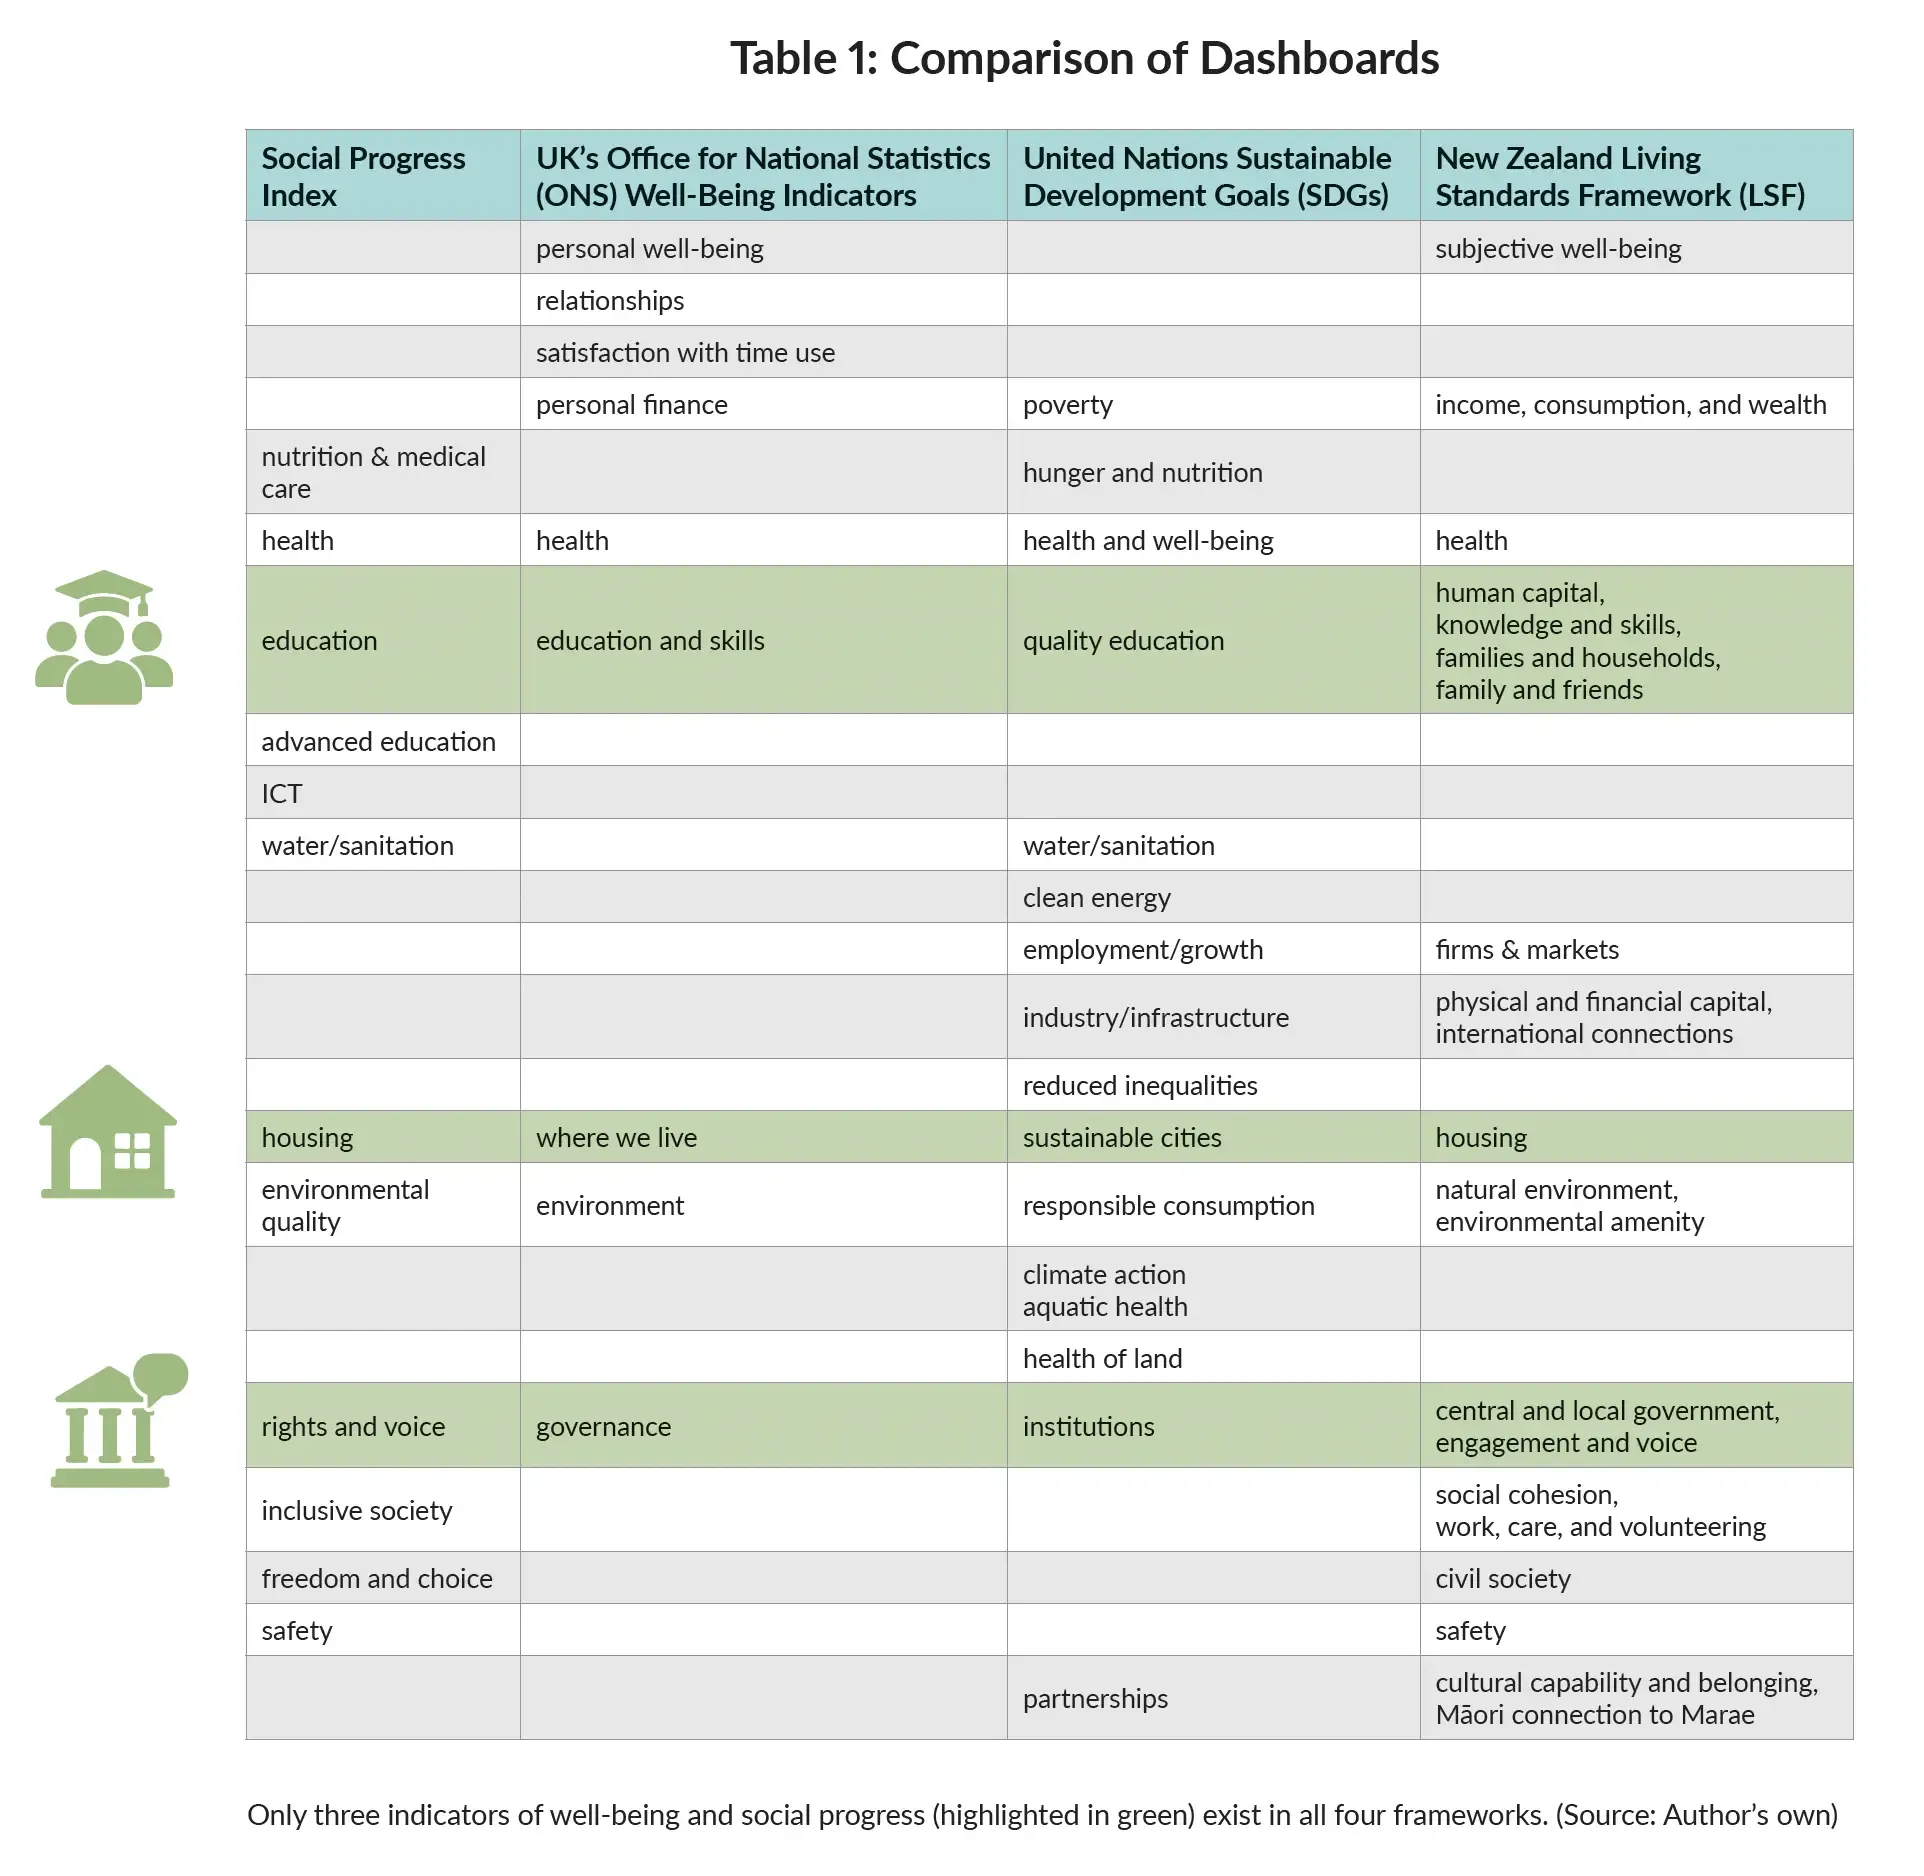
Table 1 lists the headline categories for four frequently cited dashboards, showing how little they overlap. The selection of indicators to represent an underlying concept is evidently arbitrary, in the sense that the lists do not have a clear theoretical basis, and the selection of indicators is generally determined by what data are available or even by political negotiation. For instance, I was told by someone closely involved in the process that the debate within the UN about the SDGs (Sustainable Development Goals) included a discussion about the definition of a tree; depending on the height specified in the definition, coffee bushes might or might not be included, which for some countries would affect their measure of deforestation. Practicality and arbitrary decisions certainly affect mainstream economic statistics too, but these result from decades of debate and practice among the community of relevant experts informed by a theoretical basis. We are not there yet with dashboards.
Still, there are many things people care about in life, even if one confines the question to their economic well-being. Indeed, one of my criticisms of using growth of real GDP as a guide was the flawed assumption that utility can be collapsed to a single dimension.
Comprehensive Wealth
If not well-being directly measured, nor (yet) a dashboard, nor a single index number alternative to GDP, what are the options? Consider comprehensive wealth. First, it embeds sustainability because of its focus on assets. Adding in effect a balance sheet recording stocks—or equivalently a full account of the flow of services provided by the assets—immediately highlights the key trade-off between present and future consumption. One measurement challenge is to identify the economically relevant assets and collect the underlying data. Focusing on assets revives an old debate in economics during the 1950s and early 1960s between the “two Cambridges”—Cambridge, Massachusetts, home to MIT and Harvard (where I did my PhD), and Cambridge, England (where I now work). That debate was about whether it made any sense to think of (physical) capital as a single aggregate when this would inevitably be a mash-up of many different types of physical buildings and equipment.
The American Cambridge (led by Paul Samuelson and Robert Solow) said yes, and the concept has become the “K” of production functions and growth accounting. The British Cambridge (particularly Piero Sraffa and Joan Robinson) disputed this, arguing for example that different vintages of capital would embed different generations of technology, so even a straightforward machine tool to stamp out components could not be aggregated with a twenty-year-old equivalent. Even the review articles discussing the debate (Cohen and Harcourt 2003,6 Stiglitz 19747) take sides, but the mainstream profession has given total victory to the U.S. single-aggregate version.
A balance-sheet approach also helps integrate the role of debt into consideration of progress.
A second point in favor of a comprehensive wealth approach is that investment for future consumption always involves different types of assets in combination. This means it will be important to consider not just the stocks of different assets—whether machines, patents, or urban trees (which cool the ambient temperature)—but also the extent to which the services they provide are substitutes or complements for each other: What is the correlation matrix? A patent for a new gadget will require investment in specific machines to put it into production and may benefit from tree planting if the production process heats the factory; the trees may substitute for an air-conditioning plant and also for concrete flood defenses downstream if their roots absorb enough rain. A recent paper8 highlights the importance of understanding the complementarities: “So long as a particular irreversible capital good remains with its project, in many cases until it is scrapped, its contribution comes not solely on its own account but as a result of complementarity with other capital goods. The project’s income is not composed of distinct contributions from individual assets.”
A balance-sheet approach also helps integrate the role of debt into consideration of progress. Debt is how consumption occurs now at the expense of consumption in future. In addition to financial debt, whether issued by governments or businesses or owed by individuals, there is a large and unmeasured burden of debt to nature. In a range of natural capital assets, including a stable climate, past and current consumption is reducing future opportunities.
In summary, to track sustainable economic welfare, a comprehensive wealth approach is desirable, identifying separately the types of assets that contribute capital services to economic actors. Some of them have no natural volume units. (You can count the number of isotope ratio mass spectrometers, but how do you count the accumulated know-how of a top law firm?) Many will not have a market price at all, and if they do, it is likely not to be the shadow price relevant to social welfare, so the monetary valuation needed to aggregate individual assets (by putting them into a common unit of account) is problematic.9 And the complementarities and substitutability across categories need to be better understood, including non-market assets such as organizational capabilities. (The development economics literature talks about this in terms of institutions or social capital; Singapore had few physical assets and little manufacturing industry to speak of in 1946, so it clearly relied on other assets to become one of the world’s highest per capita income countries.)
This is a challenging measurement agenda to say the least, but it is an obvious path for statistical development. Some readers will find the sustainability argument the most persuasive. There are two other supporting rationales, though. One is that a significant body of economic theory (appealing to both neoclassical and heterodox economists) supports it:10, 11 An increase in comprehensive wealth, at appropriately measured shadow prices, corresponds to an increase in social well-being. The other is that the statistical community has already started heading down this path with the agreement of UN statistical standards for measuring (some) natural capital and the services it provides.
The 2025 System of National Accounts (SNA) revision will include a little more detail about how official statisticians should be implementing this. It is a giant step forward, conceptually and practically— although it does not go far enough in that it insists on the use of valuations as close as possible to market prices, when the main issue in accounting for the environment is that markets grotesquely misprice resource use. (SNA is an internationally agreed-upon framework for compiling economic data, providing a standardized approach to measuring economic activity, including GDP and other key economic variables, facilitating analysis and policy-making.)
Conclusion
Today’s official framework for measuring the economy dates from an era when physical capital was scarce and natural resources were seemingly unconstrained. Manufacturing was the leading sector of the economy, and digital technology was in its infancy. The original national accounts were created using a mechanical calculating machine, not on a computer. Digital technologies have transformed the structure of production and consumption, and at a time of such significant structural change the supply side of the economy needs to be taken seriously. Policy decisions taken now will affect people’s lives for decades to come because the structure of so many industries is changing significantly. It is no wonder industrial policy is back in fashion among policymakers.
Unfortunately, there are yawning gaps in our basic statistics. Official statisticians do important work even as many governments have been cutting their budgets. However, the focus of the statistical agencies is on incremental improvement to the existing System of National Accounts, which will change for the better but not by much when the new standards are confirmed in 2025. There are huge data collection and analytical gaps in what is needed now, comprehensive wealth and time use, and a huge intellectual agenda when those statistics do become available. Just as the production of the first GDP figures gave birth to theories of economic growth, so sustainable balance sheet and time-use metrics will be generative for economists thinking about how societies progress.
The critiques of the earlier Beyond GDP movement have given way to a more constructive period of statistical innovation.
There is no doubt this area of economic statistics will continue to expand—because it is all too obvious that something new is needed. The critiques of the earlier Beyond GDP movement have given way to a more constructive period of statistical innovation—and I have given some examples of fruitful new methods and types of data.
However, I think some conclusions are clear. Measures that account for sustainability, natural and societal, are clearly imperative; the comprehensive wealth framework does this, and can potentially provide a broad scaffolding that others can use to tailor dashboards that serve specific purposes. A second conclusion is that while ideas have always driven innovation and progress, their role in adding value is even more central as the share of intangible value in the economy increases.
Finally, economic value added cannot be defined and measured without an underlying conception of value. This normative conception varies greatly between societies and over time, not least because of profound changes in technology and structure. It is a question of public philosophy as much as economics. Welfare economics has hardly moved on from the heyday of social choice theory in the 1970s, with social welfare defined as the sum of individual utilities; the philosophically rich capabilities approach has made little headway in everyday economics, except perhaps for development economics.
It is not yet clear whether the OECD economies will break away from the public philosophy of individualism and markets that has dominated policy for the past half century, despite all the critiques of neoliberalism; but the fact of popular discontent and its political consequences suggest they might. No wonder commentators so often reach for Gramsci’s famous Prison Notebooks comment, “The old order is dying and the new cannot be born; in this interregnum a great variety of morbid symptoms appear.”
Economic value added cannot be defined and measured without an underlying conception of value.
If a new shared understanding of economic value emerges from the changes underway now, it will look quite different. It will acknowledge the importance of context and variety, moving beyond averages and “representative consumers.” It will incorporate collective outcomes alongside individual ones, while recognizing the differences between them due to pervasive externalities, spillovers, and scale effects. And, it will embed the economy in nature, appreciating the resource constraints that limit future growth.
Excerpted and adapted by the author from The Measure of Progress: Counting What Really Matters © 2025 Diane Coyle. Reprinted with permission of Princeton University Press.