A Skeptic’s Guide to Environmental Alarmism
Writing a guide for skeptics on environmental issues is a little like trying to summarize “religion” in one article—it’s a huge topic! So here I will focus on environmental alarmism in several areas, including population, resources, pollution, global cooling, sea-level rise, species extinction, climate, polar bear demise, desertification, and wildfires, after which I will offer some good reasons for optimism.
Population
In 1968 Paul Ehrlich’s book The Population Bomb opened with the assertion that “the battle to feed all of humanity is over” and predicted that in the 1970s “hundreds of millions of people are going to starve to death.” In a 1970 television appearance, he went further, warning that within about 15 years the planet’s capacity to sustain humanity would break down. Those catastrophic forecasts obviously did not come to pass. Thanks to the Green Revolution, global food production outpaced population growth and famines became rare outside of war zones. Yet Ehrlich not only remained unapologetic; in a 2015 documentary, he said that if he wrote the book again, his language would be “even more apocalyptic,” and in a 2018 interview in The Guardian,1 he argued that the Earth’s “optimum population” is around 1.5 to 2 billion people (approximately the global population in 1927), far below today’s 8.3 billion.
Similar warnings came from others. In 1967, agronomist William Paddock and his brother Paul published Famine—1975!, claiming that the world was heading for a “population-food collision” and that “the calamity will be upon us by 1975.” The Paddocks contended that no feasible interventions could prevent mass starvation, and even suggested triaging food aid to let some nations “be ignored and left to their fate.” Like Ehrlich’s scenario, this dire vision proved wrong: food supply expanded, and the famines forecast for the mid-1970s never materialized.
Several economists in the 1960s and 1970s countered the era’s gloomy predictions by arguing that a growing population would not inevitably lead to mass starvation. In her 1965 book The Conditions of Agricultural Growth, Danish economist Ester Boserup contended that population pressure encourages the development of more intensive farming methods, challenging Malthusian assumptions about the limits of food production. Nobel laureate Simon Kuznets also emphasized the benefits of demographic growth, suggesting that more people lead to greater economic scale, a larger pool of ideas, and increased innovation—more producers and creators in both established industries and new areas.
In a similar vein, agricultural economist Colin Clark’s 1968 study Population Growth and Land Use assessed the planet’s arable land and modern farming techniques and concluded that, with the right inputs, the Earth could sustain tens of billions of people. Today the world’s population exceeds eight billion, and while famines still occur, they are mainly driven by conflict, corruption, and logistical challenges rather than the absolute shortage that some once feared.2
Alarming projections often underestimate the extent to which human institutions, technology, law, and conservation practice can alter the trajectory of environmental problems.
Yet the most striking demographic development today is not runaway population growth but collapsing fertility. The United Nations’ 2024 World Population Prospects now projects that global population will peak earlier and lower than previously expected, reaching just under 10.3 billion around 2084 before beginning a gradual decline. The reason is straightforward: fertility has fallen dramatically, from more than five children per woman in the 1960s to roughly 2.3 today globally, with Europe, the Americas, and Asia already below or near replacement level. A 2024 analysis published in The Lancet is even more striking, projecting global fertility to fall to about 1.83 children per woman by 2050 and 1.59 by 2100; by the end of the century, only six of 204 countries and territories are expected to remain above replacement fertility. In other words, the long-feared population explosion is now giving way to a very different prospect: an aging world in which many nations shrink naturally because births no longer replace deaths. This does not mean demographic change will be painless, but it does show how badly the confident Malthusian forecasts of the late twentieth century misread the direction of history.3
Resources
In the early days of the environmental movement, warnings extended well beyond worries about population growth. In the early 1970s, researchers at MIT used a computer model known as World3 to simulate how exponential increases in population and economic activity might clash with finite supplies of oil, minerals, and food. In their 1972 book The Limits to Growth, Donella Meadows and her colleagues argued that if society continued on a “business as usual” path, resource shortages could emerge by around 2000–2020, slowing economic expansion and potentially leading to societal breakdown. In a similar spirit, President Jimmy Carter cautioned in a 1977 address that the United States was running out of oil and natural gas; he anticipated that global oil production would peak in the early 1980s and warned that demand could exceed supply by the end of that decade.
Dire resource shortages never materialized largely because new reserves were found and technology increased production. Advances such as genetically modified crops, which raised agricultural yields, and hydraulic fracturing, which unlocked previously inaccessible oil and gas, have even helped make the United States the world’s leading energy producer. Economist Julian Simon argued4 that people would innovate their way around scarcity; in 1980, he famously bet Paul Ehrlich that the prices of chromium, copper, nickel, tin, and tungsten would fall by 1990 rather than rise. Simon won, underscoring how market responses and technological progress can avert shortages. Predictions of imminent “peak oil” have circulated since the late 19th century, yet supply has generally kept pace with demand. Resources are finite, but history shows that human ingenuity often extends their availability. And as economists note, we will never run out of oil. Long before the last barrel of crude is pumped from the ground, supply and demand would cause oil prices to skyrocket, leaving no economic incentive to continue pumping.
Pollution
In 1970, fears about pollution ran high: the Cuyahoga River in Cleveland had recently caught fire, and Los Angeles was regularly shrouded in lung-choking, eye-stinging smog. Some commentators warned that if emissions kept rising, the skies would darken and human health would suffer. A January 1970 Life magazine even suggested that city dwellers might need gas masks within a decade and that by 1985 air pollution could cut sunlight reaching Earth by half, leading to climate cooling. UC Davis ecologist Kenneth Watt added5 that unchecked fossil-fuel emissions would eventually filter out so much light that land would become unusable and that worsening air quality could kill hundreds of thousands of people within a few years.6
Environmental risks … unfold in complex social-ecological systems where public discourse, technology, markets, and governance matter as much as natural constraints.
The U.S. Clean Air Act of 1970, along with comparable legislation abroad, greatly reduced levels of particulates, smog, lead, and other pollutants over the following decades. Rather than cutting sunlight in half by 1985 as some feared, air quality in many cities actually improved, and even Los Angeles’ notorious smog diminished significantly.7
Since the mid-1980s, air quality has improved even further as pollution control moved from broad regulation to practical engineering. Factories, power plants, and waste facilities increasingly adopted scrubbers, fabric filters, electrostatic precipitators, activated carbon injection, and other filtration systems to remove particulates, sulfur compounds, mercury, dioxins, and other toxic emissions before they reached the air.8
Motor vehicles became dramatically cleaner as catalytic converters and unleaded gasoline reduced carbon monoxide, hydrocarbons, and nitrogen oxides; EPA notes that the 1970 Clean Air Act required a 90 percent reduction in emissions from new automobiles, a target that helped drive the adoption of modern vehicle emissions technology. Municipal incinerators also became far cleaner: EPA reported that municipal waste combustor rules cut dioxin and furan emissions by more than 99 percent from 1990 to 2005. Recycling and better waste management reduced the amount of material requiring disposal and helped avoid additional emissions; EPA estimates that recycling, composting, combustion with energy recovery, and landfill practices in 2018 saved more than 193 million metric tons of carbon dioxide equivalent.9
The broader result is clear: between 1980 and 2015, U.S. gross domestic product rose 153 percent, vehicle miles traveled rose 106 percent, energy use rose 25 percent, and population grew 41 percent, while emissions of the six principal air pollutants fell 63 percent. By 2024, EPA reported that aggregate emissions of those pollutants had fallen 79 percent since 1970, even as the economy, travel, energy use, and population all increased. This is a striking example of environmental improvement through technology, regulation, and adaptation. In this case, alarming predictions spurred action: worries about a polluted future helped drive the enactment of regulations that effectively addressed the problem.10
Global Cooling
In the early 1970s, public anxiety about the environment extended to the idea of “global cooling”—the notion that rising pollution and mid-century temperature declines might signal an impending ice age. Researchers noted that industrial aerosols could block sunlight and observed a cooling trend from the 1940s through the 1970s. During the first Earth Day in 1970, Kenneth Watt warned11 that if existing trends persisted, global temperatures could fall by about four degrees by 1990 and eleven degrees by 2000, enough to trigger more glaciation.12
Media coverage echoed these fears: Newsweek’s 1975 article “The Cooling World” framed the temperature drop as a serious threat to food supplies, and Life magazine suggested that soaring dust and cloud levels could block sunlight and usher in a new ice age. Around the same time, climatologist Reid Bryson cautioned13 that unchecked aerosol pollution might induce runaway cooling and glaciation within decades.
Dire resource shortages never materialized largely because new reserves were found and technology increased production.
What ultimately happened was not that human intervention narrowly prevented a new ice age. Rather, the “global cooling” scare was an over-extension of a short-lived mid-century temperature trend. Global temperatures did level off and may have cooled slightly, from roughly the 1940s to the 1970s, probably because natural variability combined with the cooling effects of industrial aerosols from factories, power plants, and motor vehicles. NASA notes that this mid-century pause can be explained by such aerosols and natural variability, not by the onset of a long-term planetary cooling trend.14
Later pollution controls reduced aerosol emissions, which improved air quality but also reduced some of the masking effects that aerosols had exerted on greenhouse warming. More importantly, the larger scientific picture was never as simple as the popular press suggested. Peterson, Connolley, and Fleck found that there was no 1970s scientific consensus predicting an imminent ice age; even then, concern about anthropogenic warming appeared more often in the peer-reviewed literature than forecasts of future cooling. By the late 1970s and 1980s, the cooling narrative had largely collapsed, and the environmental debate pivoted in the opposite direction: from fears of advancing ice and failing harvests to fears of warming, melting ice sheets, and rising seas.15
Sea-Level Rise
As global temperatures climbed, the focus of environmental fears shifted from cooling to warming. In a 1988 interview, NASA climate scientist James Hansen used New York City to illustrate potential impacts,16 suggesting that unchecked sea-level rise could put the West Side Highway and even nearby traffic lights underwater within forty years—implying a local increase of roughly ten feet by about 2030. The following year, Noel Brown, then head of the UN Environment Programme’s New York office, told the Associated Press17 that if global warming were not reversed by 2000, rising seas could wipe entire nations off the map; he envisaged oceans climbing by up to three feet, enough to inundate low-lying island states such as the Maldives.18
By the 1990s, there was mounting anxiety about rising seas and eroding coastlines. On September 18, 1995, The New York Times quoted19 coastal experts who warned that at the then-anticipated pace of sea-level rise, most Atlantic beaches from Florida to New England could disappear within 25 years. In other words, they suggested that around 2020 the East Coast’s major beaches might be lost to erosion unless more sand was replenished. Those forecasts were grounded in concerns about accelerating shoreline retreat and insufficient beach nourishment efforts.20
What ultimately happened was more gradual than the most dramatic warnings suggested. Sea level has certainly risen: the National Oceanic and Atmospheric Administration (NOAA) estimates that global mean sea level is about 8–9 inches higher than in 1880, and NASA reports that satellite measurements show roughly four inches of rise since 1993, with the rate increasing in recent decades. But the specific near-term imagery used in some forecasts did not materialize.21
The West Side Highway was not underwater by the mid-2020s, and tide gauge data from The Battery in New York show a long-term relative sea level trend of about 2.95 millimeters per year, equivalent to roughly one foot per century—not ten feet in forty years. Likewise, low-lying island nations such as the Maldives remain vulnerable, but they were not wiped off the map by 2000; current assessments instead emphasize continuing adaptation to a serious but slower-moving threat, with projected sea-level rise of roughly 0.5 to 0.9 meters by 2100. Thus, sea-level rise is real and poses long-term coastal risks, but the most apocalyptic deadlines overstated both the pace and immediacy of the danger.22
Species Extinction
In the early 1970s, some commentators raised alarm about a looming collapse in global biodiversity. Look magazine quoted S. Dillon Ripley, then head of the Smithsonian Institution, as saying that if existing trends continued, between three-quarters and four-fifths of all animal species could disappear within 25 years—comparable to the great Permian–Triassic extinction. Senator Gaylord Nelson echoed those fears, suggesting that by 1995 up to 85 percent of species might vanish. In fact, only a few hundred extinctions were documented from 1970 to 1995, mostly confined to island ecosystems and specific taxonomic groups. The International Union for Conservation of Nature has recorded23 roughly 800 extinctions over the past four centuries, a very small figure relative to the total number of species.
Although news broadcasts across North America, Australia, and Europe often give the impression that wildfire activity is exploding, the total area burned worldwide has actually declined.
Discussions about a “sixth mass extinction” are common, but mass extinctions in the geological record entail the loss of a very large share of Earth’s biodiversity—typically 60 to 75 percent of all species. In her 2014 book The Sixth Extinction: An Unnatural History, journalist Elizabeth Kolbert suggested that by the end of this century, between 20 and 50 percent of species could vanish, while only a few hundred extinctions have been recorded in recent decades. The book was widely praised and received a Pulitzer Prize. More cautiously, a 2022 article by researcher Kunio Kaiho in Nature concluded24 that current extinction rates are far below the level required for what scientists would classify as a major mass extinction.
One important reason extinction forecasts have not matched the most catastrophic predictions is that human beings do not merely destroy habitats; they also respond, regulate, and conserve. The IUCN Red List25 does not itself preserve species, but it plays an important role by identifying which species are most at risk and helping governments, conservation organizations, and researchers prioritize action. Once species are recognized as threatened, they may receive legal protection, habitat restoration, captive-breeding programs, reintroduction efforts, anti-poaching enforcement, or controls on hunting, trade, pollution, and invasive species.
These interventions have had measurable effects. In 2021, researchers estimated26 that conservation action prevented 21–32 bird extinctions and 7–16 mammal extinctions between 1993 and 2020; without such efforts, extinction rates for birds and mammals would have been nearly three to four times higher. Thus, the story is not one of passive decline toward inevitable biological collapse. It is another example of a recurring pattern: alarming projections often underestimate the extent to which human institutions, technology, law, and conservation practice can alter the trajectory of environmental problems.
Climate
Early in the 21st century, some climate advocates and reports issued very near-term “point of no return” deadlines, intended to spur action. In March 2000, The Independent27 quoted climate scientist David Viner predicting that British winters would soon make snow so rare that it would be a novelty and that children might never see it. The remark reflected a trend toward milder winters, yet snow did not vanish from Britain. Heavy falls occurred in 2009–2010 and again in 2018, even as the long-term trend is toward fewer snowy days. A 2022 paper in the International Journal of Climatology28 pointed out that 2010 was the snowiest year in the UK in two decades, comparable to several winters in the 1970s and 1980s.29
In 2005, a joint report by the United Nations University and UNEP forecast30 that climate-linked disasters—ranging from sea-level rise to droughts and storms—could displace up to 50 million people by 2010, effectively creating a new class of “environmental refugees” and emptying some Pacific and Caribbean lowlands. Climate-induced migration is real, but the scale and timetable in that report were greatly overstated. When such mass displacements failed to occur, critics noted the discrepancy and UNEP quietly removed a map on its website that had highlighted the supposedly most vulnerable regions.31
In the early 2000s and 2010s, some politicians and activists imposed concrete deadlines on the need for climate action. In July 2009, Prince Charles warned32 that humanity had only “96 months” to prevent irreversible environmental collapse—effectively a call to slash emissions by 2017. A decade later, U.S. Representative Alexandria Ocasio-Cortez invoked a widely cited interpretation of an IPCC report when she remarked that “the world is gonna end in 12 years if we don’t address climate change,”33 a line she later said was meant hyperbolically. And in 2014, French foreign minister Laurent Fabius proclaimed that there were just “500 days to avoid climate chaos,”34 a window that would have closed in 2015.35
Dire warnings promote fear, but hope sustains momentum.
What, then, is actually happening to the climate? Independent temperature records show that the planet has warmed substantially since the late nineteenth century, and the NOAA identifies 2024 as the warmest year in the instrumental record, about 1.46 °C above the 1850–1900 pre-industrial average. NASA likewise reports that 2025 was cooler than 2024 but still among the warmest years measured. Other indicators point in the same direction: ocean heat content has risen markedly, sea level has increased, and many glaciers have retreated. NOAA’s ocean heat content records show continued heat gain in the upper ocean through 2024–2025, an important point because the oceans store most of the excess heat in the climate system.36
Thus, the question is not whether the climate is changing; it clearly is. The more difficult questions concern magnitude, attribution, regional consequences, feedbacks, and the reliability of long-range projections. Global temperature can be measured with reasonable confidence, especially when multiple independent datasets tell the same broad story, but future climate behavior is harder to forecast because clouds, aerosols, ocean circulation, water vapor, precipitation, land use change, and natural variability interact in complex ways. The IPCC itself attributes recent warming primarily to human greenhouse gas emissions, while critics argue that natural variability and model uncertainty deserve more weight.
A skeptical but scientifically defensible position, therefore, is not that climate change is imaginary, but that measured warming should be distinguished from the most catastrophic claims about what that warming will necessarily produce.
Polar Bear Demise
Environmental organizations such as Greenpeace and the World Wildlife Fund often use stark imagery to highlight the impacts of global warming, with polar bears becoming a symbol of climate change. Some campaigns suggested that these animals were on the verge of disappearing by mid-century as sea ice declined, and images of emaciated bears circulated widely. One much-viewed National Geographic video37 from 2017 was later acknowledged to depict a bear likely suffering from age or illness rather than starvation caused by climate change. According to a 2015 assessment38 led by Øystein Wiig and published by the IUCN Polar Bear Specialist Group, the global polar bear population is estimated at around 26,000 individuals (with a 95 percent confidence range of 22,000–31,000), roughly the same as or slightly higher than the numbers recorded in the 1960s and 1970s after hunting controls were introduced.

Desertification
Warnings about runaway desertification were widespread in the late 20th century. The 1978 UN Conference on Desertification suggested39 that, without urgent action, up to one-third of the planet’s land area could become desert within a few decades. In 1984, a United Press International story40 reported that UNEP estimated the Sahara was moving southward at about four miles per year, saying the Sahel loses land each decade equivalent to the size of New York State. A 2009 Smithsonian article41 about Chinguetti, Mauritania, even claimed the desert was advancing at 30 miles per year. Meanwhile, the 1987 Brundtland Report42 cast desertification as a central threat to global sustainability, warning that it could devastate food supplies and trigger famine for hundreds of millions of people. Some UN assessments went so far as to predict that tens of millions of “desert refugees” would be displaced by the year 2000.
Since the 1980s, satellite observations have shown a worldwide expansion of vegetation, particularly across semi-arid regions. The Sahel—once described as a “marching desert”—has actually greened, benefiting from improved rainfall and the fertilizing effect of elevated CO2. Rather than seeing a third of the planet turn to desert, large areas have experienced net greening, aided by higher carbon dioxide levels, better land management, and reforestation initiatives. Given the steady rise in atmospheric CO2 over the past seventy years, this trend should not come as a surprise.
Wildfires
Climate change is expected to affect wildfire and hurricane behavior over the coming century, a prediction heavily publicized in forecasts and media coverage. A June 2024 article in The Guardian43 on extreme fires warned of a “feedback loop” in which fires warm the planet, thereby triggering more fires, implying that global warming could lead to wildfires in many regions. Other reports have argued that the traditional fire “season” is vanishing. A CalMatters explainer published in 2025 noted44 that California now has 78 more “fire days” each year than it did half a century ago and that repeated droughts have made wildfires essentially a year-round phenomenon. Likewise, a Deseret News article45 on the 2020 western fires quoted a Cal Fire captain saying, “We don’t even call it fire season anymore. Take the ‘season’ out—it’s year round.” In 2022, the UN Environment Programme46 projected that extreme fires could increase by 14 percent by 2030, 30 percent by 2050, and 50 percent by 2100, warning that governments were unprepared for a growing global wildfire crisis. Earlier state-commissioned studies in the 2000s projected substantial increases in burned area and costs; for example, a University of Oregon analysis47 forecast that acres burned in Washington state would rise 50 percent by 2020 and double by 2040, with firefighting costs climbing accordingly. As early as 1999, the U.S. Government Accountability Office warned48 that without aggressive fuel-reduction work, about 10 million acres of national forests would remain at high risk of uncontrollable fires beyond 2015.

Although news broadcasts across North America, Australia, and Europe often give the impression that wildfire activity is exploding, the total area burned worldwide has actually declined. A review by Stefan Doerr and Cristina Santín of Swansea University, published in Philosophical Transactions of the Royal Society B,49 found that global burned area has decreased in recent decades and remains well below levels seen centuries ago. The authors noted that there has been no rise in the frequency of high-severity fires and no clear upward trend in fire-related deaths or economic losses, arguing that common assumptions about ever-worsening wildfires are not supported by the data. Researchers Jay Miller and Hugh Stafford, writing in the journal Fire Ecology, argued50 that decades of fire suppression that allowed combustible material to accumulate—rather than climate change—explain the observed increase in fire intensity.
Hurricanes
After the record-setting 2005 Atlantic hurricane season, some researchers and commentators speculated that warmer oceans would lead to more storms. In 2007, Greg Holland and Peter Webster published an analysis51 in Philosophical Transactions of the Royal Society A that noted an increase in North Atlantic hurricanes and linked that trend to greenhouse warming—a finding widely cited in the media as evidence that human-induced warming was boosting hurricane counts. More recently, the Intergovernmental Panel on Climate Change’s 2021 Sixth Assessment Report52 concluded that there is no clear global trend in hurricane frequency.
A Skeptical Optimism
The historical record of environmental prophecy shows a recurring pattern: bold projections, public alarm, and political response followed by outcomes that are far more nuanced than early forecasts suggested. The Malthusian famine that Paul Ehrlich and others predicted for the 1970s never happened. Over and over, human ingenuity and adaptive policy intervened—whether through new crop varieties, improved pollution controls, or alternative energy sources. Time after time, extrapolations that ignore feedbacks and innovations have been overtaken by reality. This is not to dismiss environmental risks but to emphasize that they unfold in complex social-ecological systems where public discourse, technology, markets, and governance matter as much as natural constraints.53
Balanced forecasting therefore requires two commitments: a clear-eyed view of risks and an appreciation of our capacity to respond.
Balanced forecasting therefore requires two commitments: a clear-eyed view of risks and an appreciation of our capacity to respond. Dire warnings promote fear, but hope sustains momentum. Grounding our predictions in both scientific evidence and the historical record of human resilience allows us to chart a course that is prudent and realistic. This raises an important question: should we commit large sums of money to new green energy based solely on grim global warming projections, especially when many past predictions have missed the mark?
In a 2024 Fraser Institute report,54 Vaclav Smil of the University of Manitoba argues that wind and solar suffer from low power density and intermittent output, making it difficult and costly to match the reliability of fossil-fuel or nuclear plants. He notes that when storage and backup are included, the levelized cost of solar technology entering service in 2027 is only nine percent lower than that of combined-cycle gas, onshore wind is roughly comparable to gas, and offshore wind coupled with battery storage could be more than three times as expensive as combined-cycle gas. Smil concludes that achieving net-zero energy would require unprecedented amounts of new non-carbon energy and materials, potentially costing affluent countries at least 20 percent of annual GDP. The same report highlights that despite three decades of public pressure and large renewable energy investments, global fossil-fuel consumption increased by 55 percent between 1997 and 2022. This suggests that renewables and existing policy efforts will not (or cannot) displace fossil energy on a global scale. Add to this the exponential demand for energy by the AI industry, and we face failure in supplying the global economy with the requisite amount of energy.55
The International Energy Agency (IEA) notes that clean energy investment in emerging and developing economies (excluding China) makes up only about 15 percent of global clean energy investment, pointing to significant financing challenges for large-scale renewable deployment. The conundrum is that the world’s major polluters have the least ability to reverse their dependence on fossil fuels, while rich nations cannot—or are unwilling or unable to—risk the financial resources necessary to fund that transition.
Meanwhile, the Western world continues to funnel resources into clean energy. In its World Energy Investment 2025 outlook,56 the IEA expected total energy investment to rise to $3.3 trillion in 2025, with about $2.2 trillion allocated to renewables, nuclear, grids, storage, low-emission fuels, efficiency and electrification—roughly double the $1.1 trillion projected for oil, natural gas, and coal. Investment in solar (both utility scale and rooftop) is forecast to reach $450 billion. These figures indicate that clean-energy investment will continue to dominate global energy spending.57
Here, it is important to recognize that projections of future climate risks depend substantially on computer models, whose reliability rests on how accurately they represent complex climate processes and perform against observed outcomes. As Aynsley Kellow, emeritus professor at the University of Tasmania, Australia, reminds us, “climate modeling has generated projections that have proven to be both exaggerated and wrong. Models should not be tested against the data from which they are constructed, but against the accuracy of their projections.”
For one thing, no matter how complex a computer model is, it is highly dependent on the starting parameters. In his classic 1963 paper, meteorologist Edward Lorenz introduced a simple set of three ordinary differential equations to model convection in the atmosphere. When Lorenz chose parameters, he discovered that the solutions never settled into a steady state. Instead, almost all trajectories approached a complicated, butterfly-shaped “strange attractor” and exhibited sensitive dependence on initial conditions—the butterfly effect: two trajectories starting from nearly identical states diverged rapidly until they were uncorrelated. This meant that the system’s long-term behavior was effectively unpredictable even though the underlying equations were deterministic.
Time after time, extrapolations that ignore feedbacks and innovations have been overtaken by reality.
Lorenz concluded that even simplified models of weather can display inherent unpredictability, implying that there is a fundamental limit to long-range weather forecasting. His work gave birth to the field of chaos theory by showing that deterministic systems can generate irregular, nonperiodic behavior.
The book Climate Change: The Facts 2025 is a series of papers assembled by editors John Abbot and Jennifer Marohasy (both former Senior Fellows at the Institute of Public Affairs in Melbourne, Australia). Much of the book challenges the use of computer models to make predictions about the climate crisis.
One of the central challenges in assessing future climate risk is distinguishing between natural variability and human influence. In the introductory paper, Abbot provides a clear reminder that Earth’s climate is inherently cyclical, with fluctuations on timescales of centuries to millennia. Evidence from ice cores, sediments, and multiproxy reconstructions reveals repeating warm and cool periods, including the Medieval Warm Period (MWP) around 900–1200 CE and the Little Ice Age (LIA) from roughly 1400–1850 CE. These shifts were global in scope, dramatic in scale, and occurred without the elevated CO2 concentrations present today.
Yet the way scientists chose to reconstruct past temperatures dramatically changes the story we tell about climate history. This can be seen by contrasting the influential “hockey stick” graph58 constructed by Michael Mann of the University of Massachusetts and his colleagues in 1999 with later multiproxy reconstructions59 from Fredrik Ljungqvist of the University of Stockholm in 2010 (see the schematic diagram below).
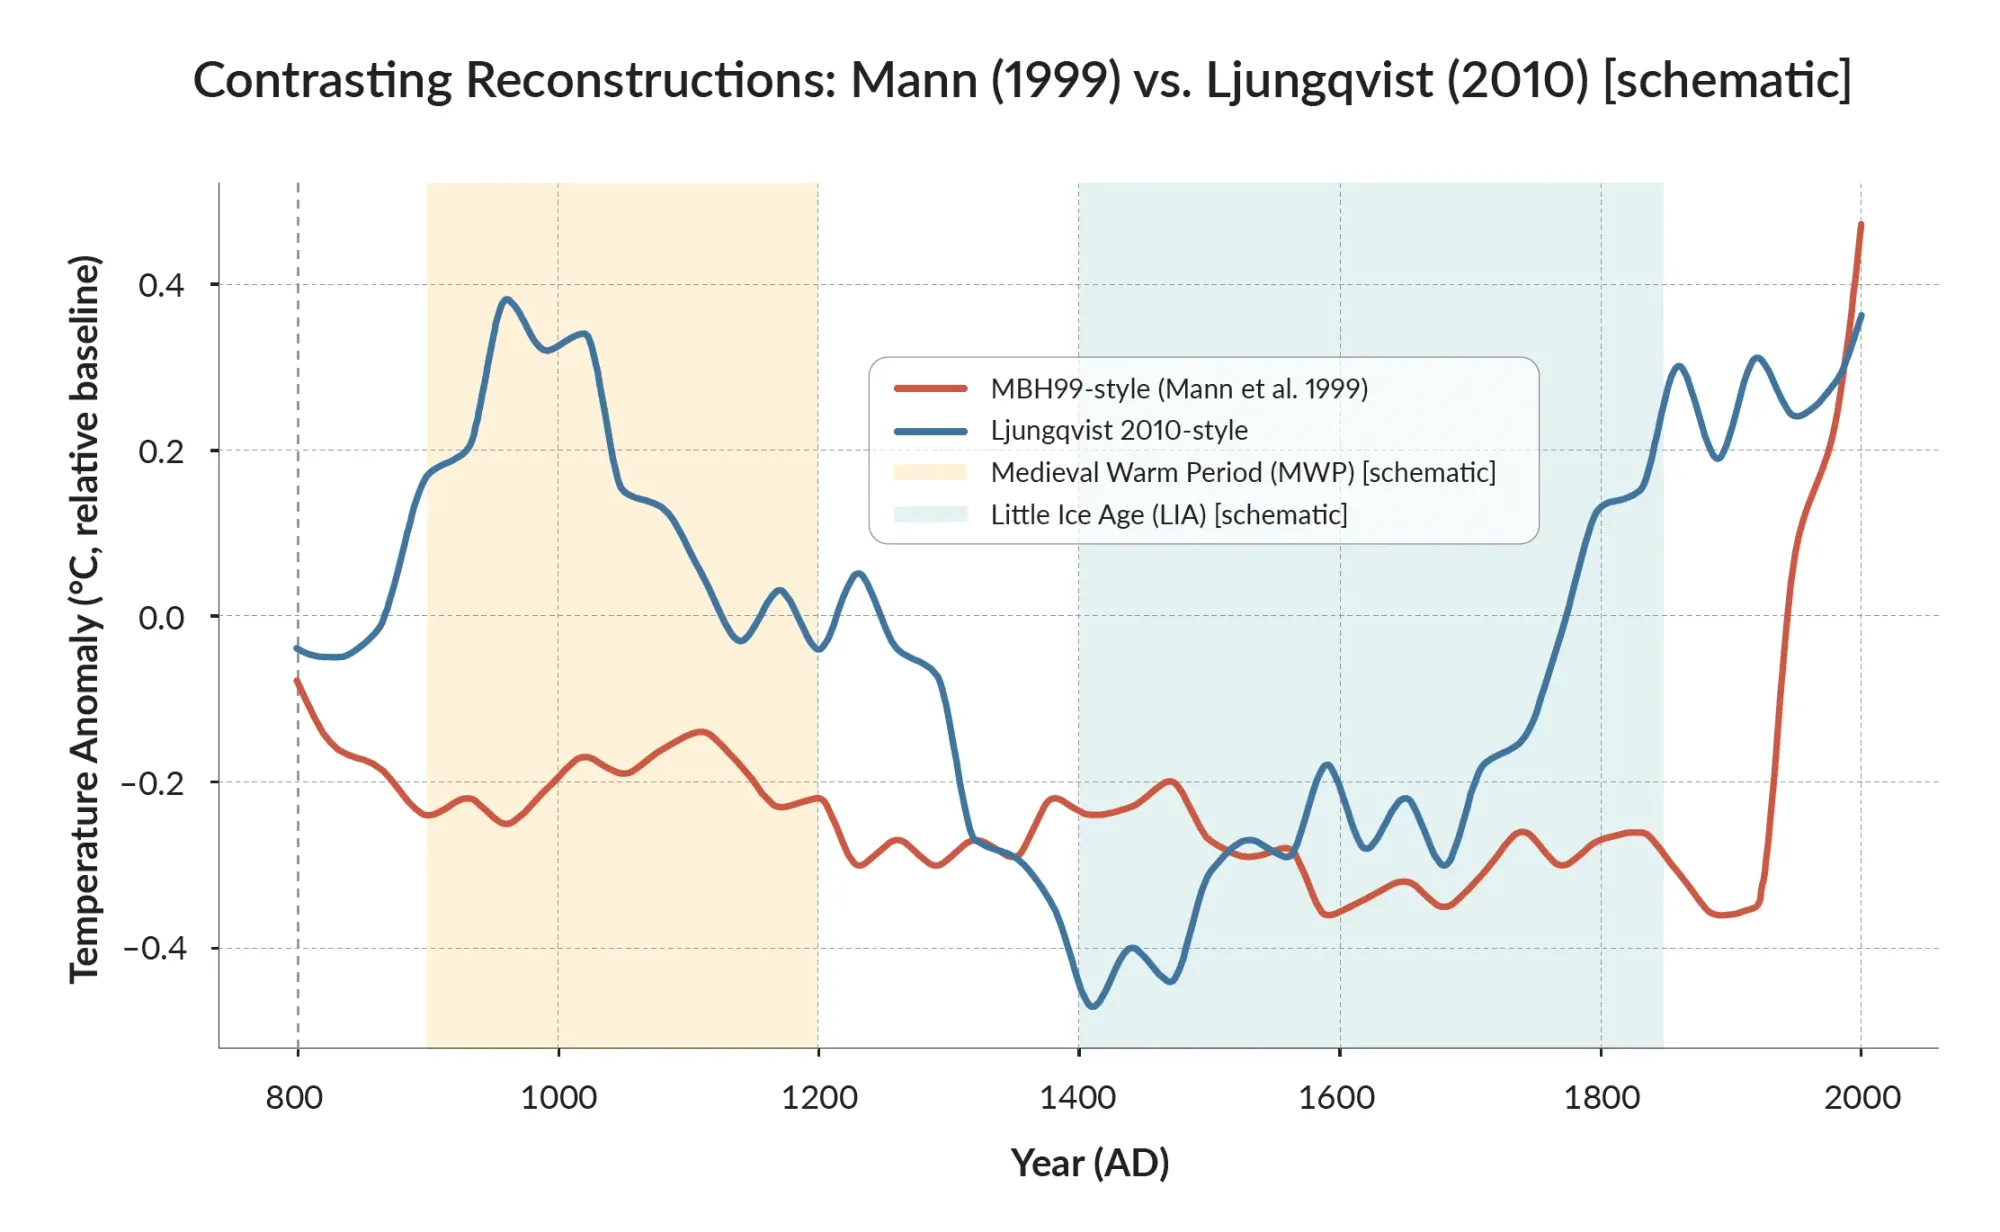
The Mann hockey stick (red line) shows a relatively flat millennium-long climate record, with only a sharp rise in the 20th century. The muted MWP and LIA are largely the result of methodological choices. Mann’s reconstruction relied heavily on tree-ring proxies from North America, which are not well suited to capturing long-term swings in temperature. Many tree rings respond more strongly to precipitation or ecological stresses than to temperature, and the limited geographic coverage ignored much of the globe where the MWP and LIA were pronounced. Statistical weighting further suppressed variability, effectively flattening the pre-industrial climate. In its early assessments, the IPCC drew on five separate temperature reconstructions to argue that recent Northern Hemisphere warmth was unprecedented in the last millennium, but it highlighted one chart—the hockey-stick graph. That image, showing a long flat trend followed by a sharp modern upturn, came to be viewed by the media and general public as the keystone of the IPCC’s case for human-driven warming and an unfolding climate crisis.
By contrast, the Ljungqvist plot (blue line) draws on a broader set of proxies—including ice cores, boreholes, corals, and sediments—and shows much more pronounced swings, with a warm MWP, a cold LIA, and still a modern uptick. This reconstruction aligns closely with Abbot’s emphasis on millennial-scale cycles that have long shaped Earth’s climate.
The differences are not trivial. If the climate of the past 1,000 years was largely flat until the industrial era, then today’s warming must be explained almost entirely by human greenhouse gas emissions. But if large natural swings—as seen in Ljungqvist and many other reconstructions—are a recurring feature of the climate system, then at least part of the warming over the past century could reflect a phase of natural variability. Abbot concludes, “Both the MWP-LIA cycle and hockey stick profiles can be interpreted as being based on a dominant millennial oscillation in the range of 978–1306 years. Superimposed on this millennial oscillation are sets of centennial and decadal oscillations.”
Abbot applied artificial neural networks (ANNs) to climate data and used them to support his contention that much of recent warming could be part of natural long-period cycles rather than human-induced. By decomposing proxy temperature series into sums of sine waves at those long frequencies and feeding them into an ANN trained only on pre-1880 data, Abbot shows that the network reproduces the post-1880 temperature rise without any anthropogenic forcing. From this experiment he derives an equilibrium climate sensitivity of roughly 0.6–0.8 °C per CO2 doubling, well below the IPCC’s 2–4.5 °C range. He concludes that general circulation models underestimate the amplitude of natural oscillations and therefore overstate the role of greenhouse gases, whereas his ANN-based method interprets modern warming largely as a continuation of long-term natural cycles, though he notes that human emissions may still play a role.
Later in the book, emeritus professor Ian Plimer at the University of Melbourne emphasizes that Earth’s climate has always changed, often drastically, due to natural forces such as variations in Earth’s orbit and tilt, fluctuations in solar output, volcanic eruptions, tectonic shifts, and even the Solar System’s passage through the galaxy. He argues that climate records spanning hundreds of millions of years show little correlation between atmospheric carbon dioxide and global temperature, suggesting CO2 is not the primary climate driver (see diagram below). Instead, he highlights how supervolcanoes and tectonic events can cool or warm the planet; how past interglacial periods were warmer than today; and how long cycles in solar activity and cosmic rays may set the pace for ice ages and warm spells.
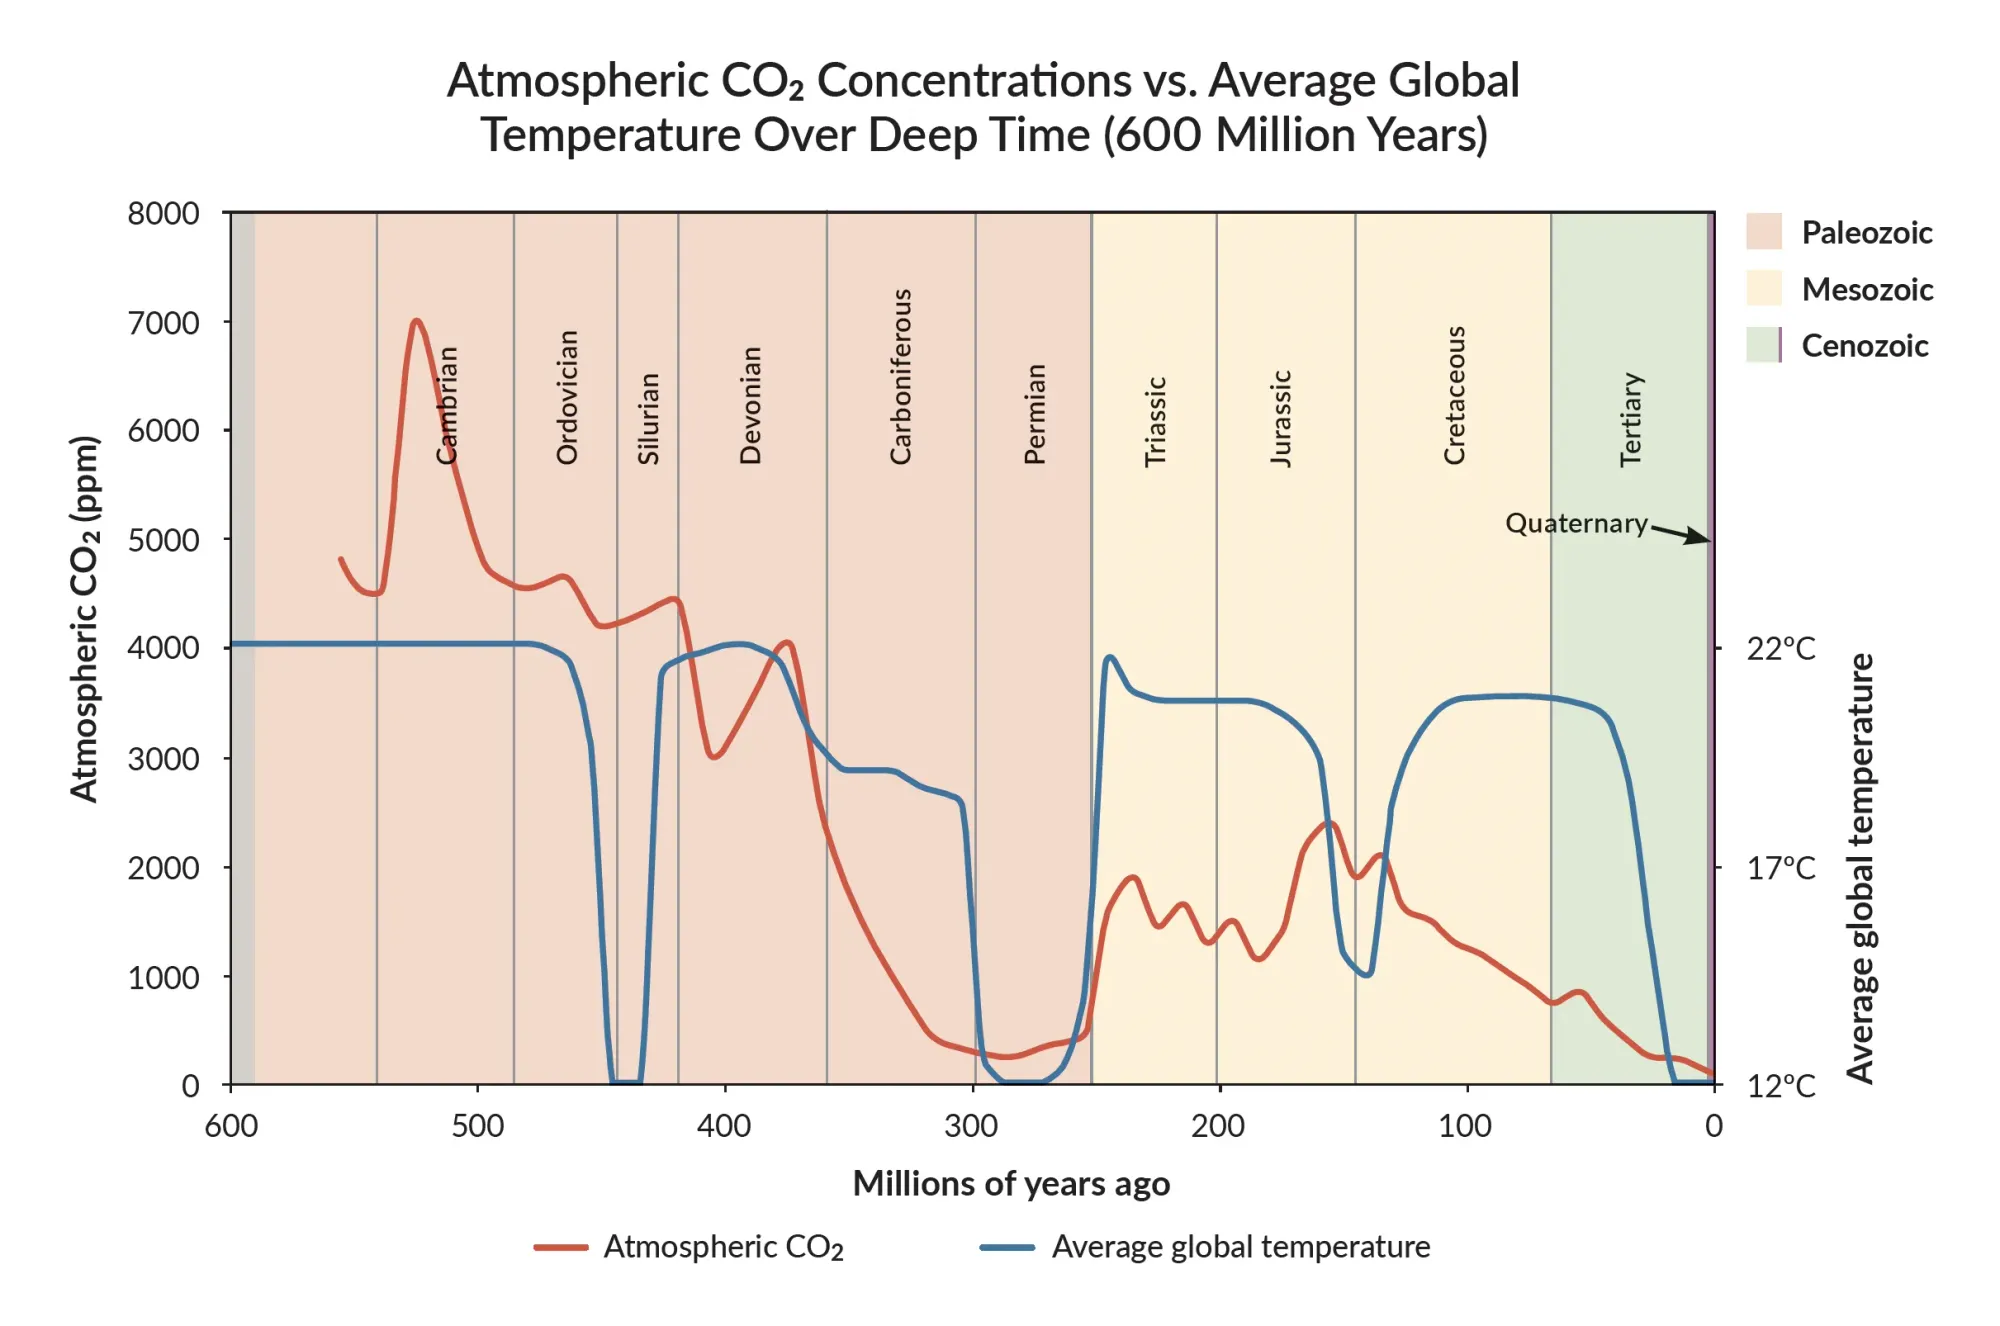
From his geological perspective, modern warming should be viewed against the backdrop of Earth’s long, naturally variable climate history.
In another chapter, emeritus professor at the University of Delaware David R. Legates highlights that precipitation is the “Achilles’ heel” of global climate models because rainfall and snowfall occur on scales much smaller than the models’ grid cells and depend on complex feedbacks. He notes that most models simulate convection but neglect other key mechanisms, leading them to produce precipitation that is too frequent and too light, overestimate rainfall in the tropics, underestimate it in mid-latitudes, and miss daily cycles. Simplified topography and differing horizontal resolutions further distort wind patterns and rainfall distribution. Since precipitation controls soil moisture, runoff, cloud cover, and evaporation, Legates concludes that errors in simulating rain and snow propagate through nearly every climate variable. He suggests that as the atmosphere warms, the reduced temperature gradient will likely diminish the very processes that create precipitation, meaning climate projections must handle rainfall with caution and more observational and theoretical work is needed before trusting future precipitation forecasts.60
Associate professor Antero Ollila also contends that recent warming is largely driven by natural factors—long-term oceanic and solar cycles—while human-emitted greenhouse gases play only a modest role. He argues that the radiative forcing attributed to a doubling of CO2 is lower than the IPCC’s 3.7–3.9 Wm–2 estimate and that observations show little evidence of the strong positive water-vapor feedback assumed in mainstream models. Based on his own energy-balance modeling and a survey of non-IPCC studies, Ollila calculates a transient climate response of roughly 0.5–0.7 °C per CO2 doubling. He emphasizes that multidecadal and centennial oscillations can explain much of the temperature variability since the mid-20th century. Using carbon-14 data, he further suggests that human-emitted CO2 is quickly removed by natural sinks and represents a much smaller fraction of atmospheric CO2 than commonly asserted. From these considerations, Ollila concludes that there is no imminent climate crisis and advocates focusing on adaptation rather than aggressive emissions reductions.
The contrarian debate presented in the book highlights the uncertainty that underlies climate prediction. Many past environmental forecasts—whether the desertification crisis projected by the UN in the 1970s, predictions of ice-free Arctic summers by the 2010s, or warnings of runaway warming by mid-century—have overstated the degree of certainty about future conditions. If natural cycles continue to exert a strong influence, the trajectory of future temperatures may not follow simple linear projections tied to carbon emissions alone.
It is important to note that the book challenges the dominant climate narrative, but it does not represent the center of expert judgment. The center of that judgment is that the planet is warming, that human greenhouse gas emissions are the leading cause, and that continued emissions will increase risks.
At the same time, even mainstream projections have moderated from some older worst-case assumptions, with current policy estimates clustering closer to roughly 2.5–3 °C of warming by 2100. That distinction matters: it leaves room for skepticism toward apocalyptic rhetoric without requiring denial of measured warming or human influence.